As a National Weather Service SKYWARN storm spotter, I like to keep a close eye on the weather, especially when severe weather is in the forecast. For those days, I created this web page, together with the larger “Daily Weather Charts“ and the smaller “micro version.” The intent is to give me an amateur's "map room" for north Alabama. However, this is not a map room in the conventional sense, since it is not my intent to make a weather forecast. Instead, the purpose of this page is to answer these questions:
Is
today a severe weather day?
If
so, what, where and when?
Please
feel free to copy and adapt this page to your needs.
A URL for
this page: http://tinyurl.com/6hwnh2
Current Conditions

Source: Hydrometeorological Prediction Center, NCEP, NWS
24-hour Current Conditions Loop - Hydrometeorological Prediction Center
Other
Surface Maps
Fronts/Analysis: North America | CONUS - Hydrometeorological Prediction Center, , Hydrometeorological
Prediction Center (HPC), National
Centers for Environmental Prediction (NCEP), National
Weather Service (NWS), National
Oceanic and Atmospheric Administration (NOAA), US Department of
Commerce
Analysis/Satellite Composite (North America) - Hydrometeorological Prediction Center, NCEP, NWS
Analysis/Satellite Composite (N Amer/Pacific) - Hydrometeorological Prediction Center, NCEP, NWS
GOES E & W Satellite Composite - Hydrometeorological Prediction Center, NCEP, NWS
Current
Surface Webpage,
RAP Real-Time Weather Data, National Center for Atmospheric Research
(NCAR) , University Corporation for Atmospheric Research (UCAR)
North
American Surface Analysis Products, NCEP, NWS
North
America Surface Analysis (Loop),
HPC, NCEP, NWS
Current
Conditions,
The
Weather Channel
Southeast
Fronts Surface Map,
WAAY-TV
Current
Frontal Analysis Plot (Inverted), Unisys
Build
Your Own Weather Map and Forecast
Tools, Storm Prediction Center (SPC), NWS
Daily Weather Map
Weekly
PDF Files
Radar Images
US National Radar
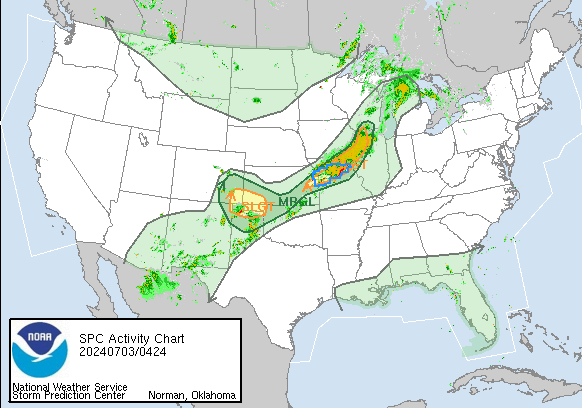
If
there is a notation "See Text," refer to the text messages
at Day
One Convective Outlook.
Source: Storm
Prediction Center, National Weather Service (NWS)
Lower Mississippi Valley Sector Radar

SE US – Infrared

Source: Aviation Weather Center, NOAA

Surface and Upper
Air Maps
RAP
Real-Time Weather Data
The National Center for Atmospheric
Research (NCAR)
Operated by the University Corporation of
Atmospheric Research
500 mb Upper Air Map

Source: RAP Real-Time Weather Data
Take
particular note of the 540 line (corresponds roughly to freezing at
sea-level).
An additional 500 mb Map is available from Department
of Commerce: Daily
Weather Map
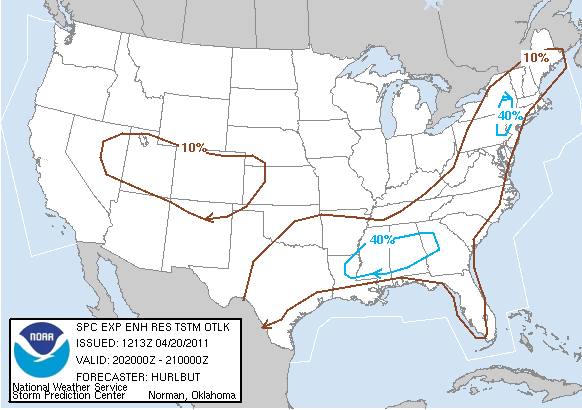
Convective
Outlook, Day 1
Storm
Prediction Center, NWS

If there is a notation "See Text," refer to the text messages at the Day One Convective Outlook. Convective Outlooks for Day 1 Through Day 8 are also available. This is the 1300 update. More recent graphics may be available at Convective Outlook, Day 1

This forecast is good for the next 12 hours, as of the date and time indicated on this graphic. For longer range forecasts, consult your local National Weather Service office web site or other reliable media outlets.
Source:
Thunderstorm
Forecast, The
Weather Channel
See
also: Weather Underground Interactive
Tornado Map of Recent Storms and
U.S.
Severe Weather Map,
Weather
Underground
Also for my area: Southeast
Severe Weather Map.


National Weather Service's
Enhanced
Resolution Thunderstorm Outlooks
Storm Prediction
Center, NCEP, NWS
National
Forecast Map
Hydrometeorological
Prediction Center, NOAA

[ Day One Convective Outlook | Final Extended Forecast Discussion ]
These discussions occasionally mention longitudes and latitudes; this link may provide some assistance in locating these features.
Map
of North American Continent (with longitude and latitude)
Source:
WorldAtlas.com
Graphical Forecast for Northern Alabama
Huntsville Office, NWS
|
|
|


Graphical Forecast for the Southern Mississippi Valley
Pryor Field, Decatur, AL - Current Conditions | Meteogram | Text Archive
Local Forecast Text Products
Hazardous Weather Outlook (HWO)
Area Forecast Discussion (AFD)
24-Hour NAM 4-Panel Plot, Unisys
References
Acronyms and Glossary at JetStream – Online Weather School at the Southern Region Headquarters of the National Weather Service; an excellent resource.
Other Local Severe Weather Day Resources
-
Huntsville Office, National Weather Service
-
SKYWARN Storm Spotter Information, Huntsville Office, National Weather Service
-
NOAA Weather Radio (162.400 in Huntsville area and streamed over the Internet from Weather Underground)
-
Local television weather:
▪ Channel 19 Armor Doppler Radar Loop (19-WHNT)
▪ Channel 31 Radar Loop (WAAY-31)
▪ Channel 48 Live Doppler Radar Loop (WAFF-48) -
Weather Underground Animated Radar Loop for Northern Alabama
-
Weather and emergency amateur radio for Northern Alabama
▪ SKYWARN (Huntsville: 147.24 / PL 82.5; Moulton: 146.96; Section: 147.36)
▪ ARES (Madison Co.: 146.94 / PL 100.0; Limestone Co.: 145.15)
▪ RACES (147.220 / PL 136.5)
▪ Morgan County Emergency Net (147.00)
▪ Alabama Emergency Management Agency ARES Net (3.965 MHz)
▪ kBrews Weather Spotting Frequency Lists - Alabama
▪ Amateur High Frequency Emergency Hurricane Nets
▪ Alabama NOAA Weather Radio Frequencies by County
▪ Other Alabama Emergency Nets (courtesy of Birmingham Amateur Radio Club) -
Alabama State Information from NWS
-
Tropical Weather, Weather Underground
-
IWIN. IWIN is the web version of the Emergency Managers Weather Information Network (EMWIN) service that allows users to obtain weather forecasts, warnings, and other information directly from the National Weather Service in almost real time.
Get A Kit -
Make A Plan -
Be
Informed
Links Open In A New Window At
ReadyAmerica.Com
|
|
|
|
|
|
Note:
How far out west do we need to be looking? The average cold front moves at about 30 MPH and can cover 720 miles in a day. By way of an example, the distance from Russell, KS, to Decatur, AL, is 722 mi. But a fast-moving cold front can travel at 60 MPH and can cover 1,440 miles in a day, and 720 miles in 12 hours. Again by way of example, the distance from Decatur to Salt Lake City is 1,424 miles and to Phoenix is 1,438 miles.
So as Storm Spotters, we sometimes need to be looking much further west than we might think. If I am looking at my weather pages at 6 AM, I'd need to be looking at the Kansas weather maps in order to see a fast-moving cold front that would arrive at 6 PM and I'd need to be looking at the Arizona and Utah maps in order to see a fast storm that could be here in 24 hours.
Mileages quoted are “air” miles (e.g, “as the crow flies”), based on a distance calculator located at http://www.infoplease.com/atlas/calculate-distance.html
Free
JavaScripts provided
by The
JavaScript Source
|
|
W4DDA |
|


Go To Top